The range between minimum price and maximum price is incorrect. Please submit the correct range.


Residential and Commercial Real Estate
Buying or selling a home is a big decision - you need an experienced professional to guide you through the process. When you work with me, you can count on personal, attentive, patient service, excellent knowledge of the area, great negotiation skills and expert selling strategies.
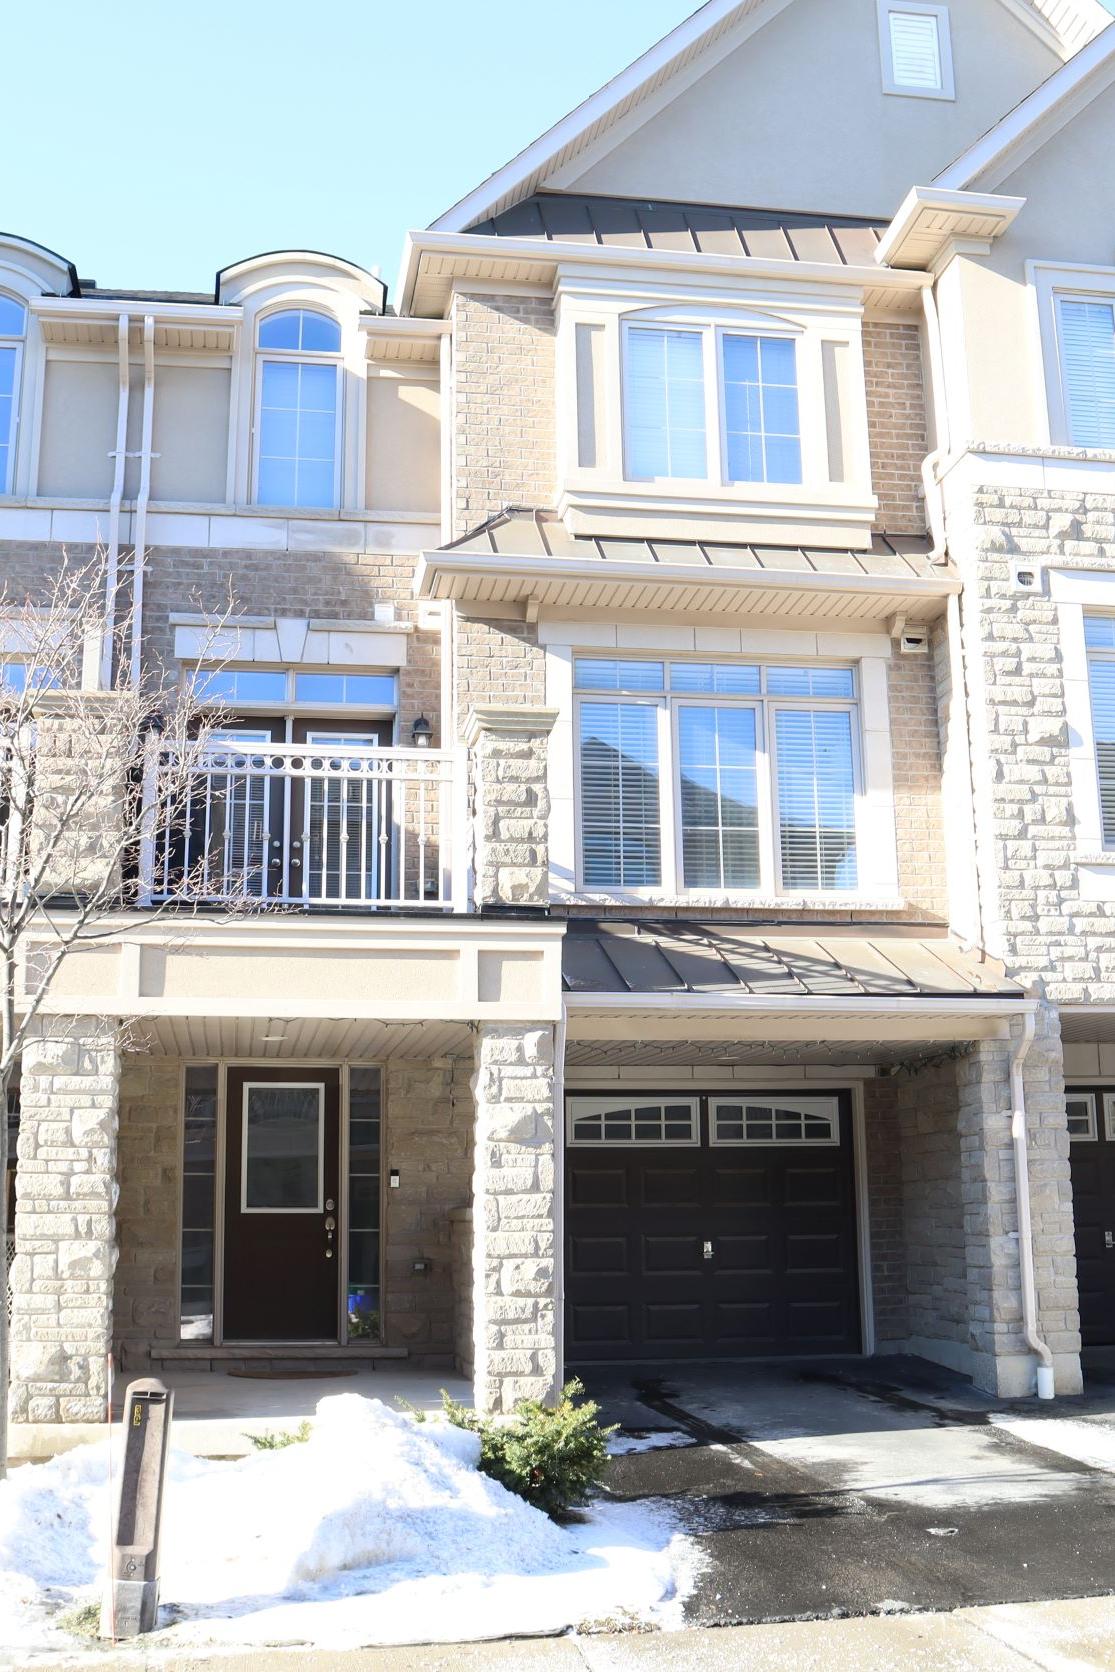
***Exclusive*** - 2-Bdrm Townhouse for Lease in Oakville, Westmount
Availability: April 1st / 2022
Modern Townhouse in Beautiful Westmount. It features Open Concept and 9’ Ceiling on Second Level, Two Bedrooms, Two Baths, Large Windows Throughout, and In-Suite Laundry. Kitchen Includes all Stainless-Steel Appliances, Large Food Prep Area, and a Breakfast Bar. Dining Area Offers a Double-Door Walk Out to The Balcony. Unit has Plenty of Storage Space and a Large Garage with Inside Entry and Automatic Remote-Controlled Main Door. Excellent Schools and all Major Amenities at Walking Distance. Property Has Had the Same Owner From Day One and It is Very Well Taken Care of.
Check the link below for details:
https://www.kijiji.ca/v-apartments-condos/oakville-halton-region/2-bedroom-townhouse-in-oakville-for-lease/1608612095
Oakville, Milton and District - Monthly Indicators - January 2022


Market Stats - October 2021
There were 9,783 sales recorded for October in the GTA at an average selling price of $1,155,345. Year over year, sales were only slightly down 6.9% from October 2020’s record number for sales, which were up by over 25% from 2019. Month over month, October 2021 sales were up by 8% from September, despite new listings dropping by over 13%. October was the 4th month in a row of declines of 30% or more in new listings being added to the market resulting in a year over year drop of just over 55% in active listings. This squeeze on supply resulted in an average price appreciation of 19.3% compared to October 2020. October also saw price appreciation in double digit territory for condos in the 416, at 10.6% year over year, climbing back from last year’s brief pandemic-induced softening.
Market Stats - September 2021
September 2021 real estate activity in the GTA showed the return to a pattern consistent with a typical fall market where the number of sales and prices notch higher over summer activity. All property types in September 2021 showed an increase in sales over the previous month of August. A year over year comparison for the month needs to take into consideration that September 2020 was still very much pandemic-influenced. It had the benefit of a 30% surge of new inventory over September 2019, resulting in the highest sales volume ever for the month. While September 2021 saw a significant drop of 49.4% in active listings compared to September 2020, it still managed to register as the third-highest for September sales on record.
Market Stats - August 2021
August 2021 TRREB MLS sales were the third best on record for the month, behind 2020 and 2016 respectively. While 8,596 sales is an impressive volume for August, GTA Realtors and their clients were working with the lowest housing supply in a decade, down 50.8% year over year and equal to just 4 weeks of inventory, and with an average price increase across all property types of 12.6%. Condos were the only property type with increased unit sales from a year ago. With a price differential of 107% between condos and detached homes, despite the average condo price climbing to a new high of $688,568, condos were a significantly more affordable option than the average detached home at $1,423,807.
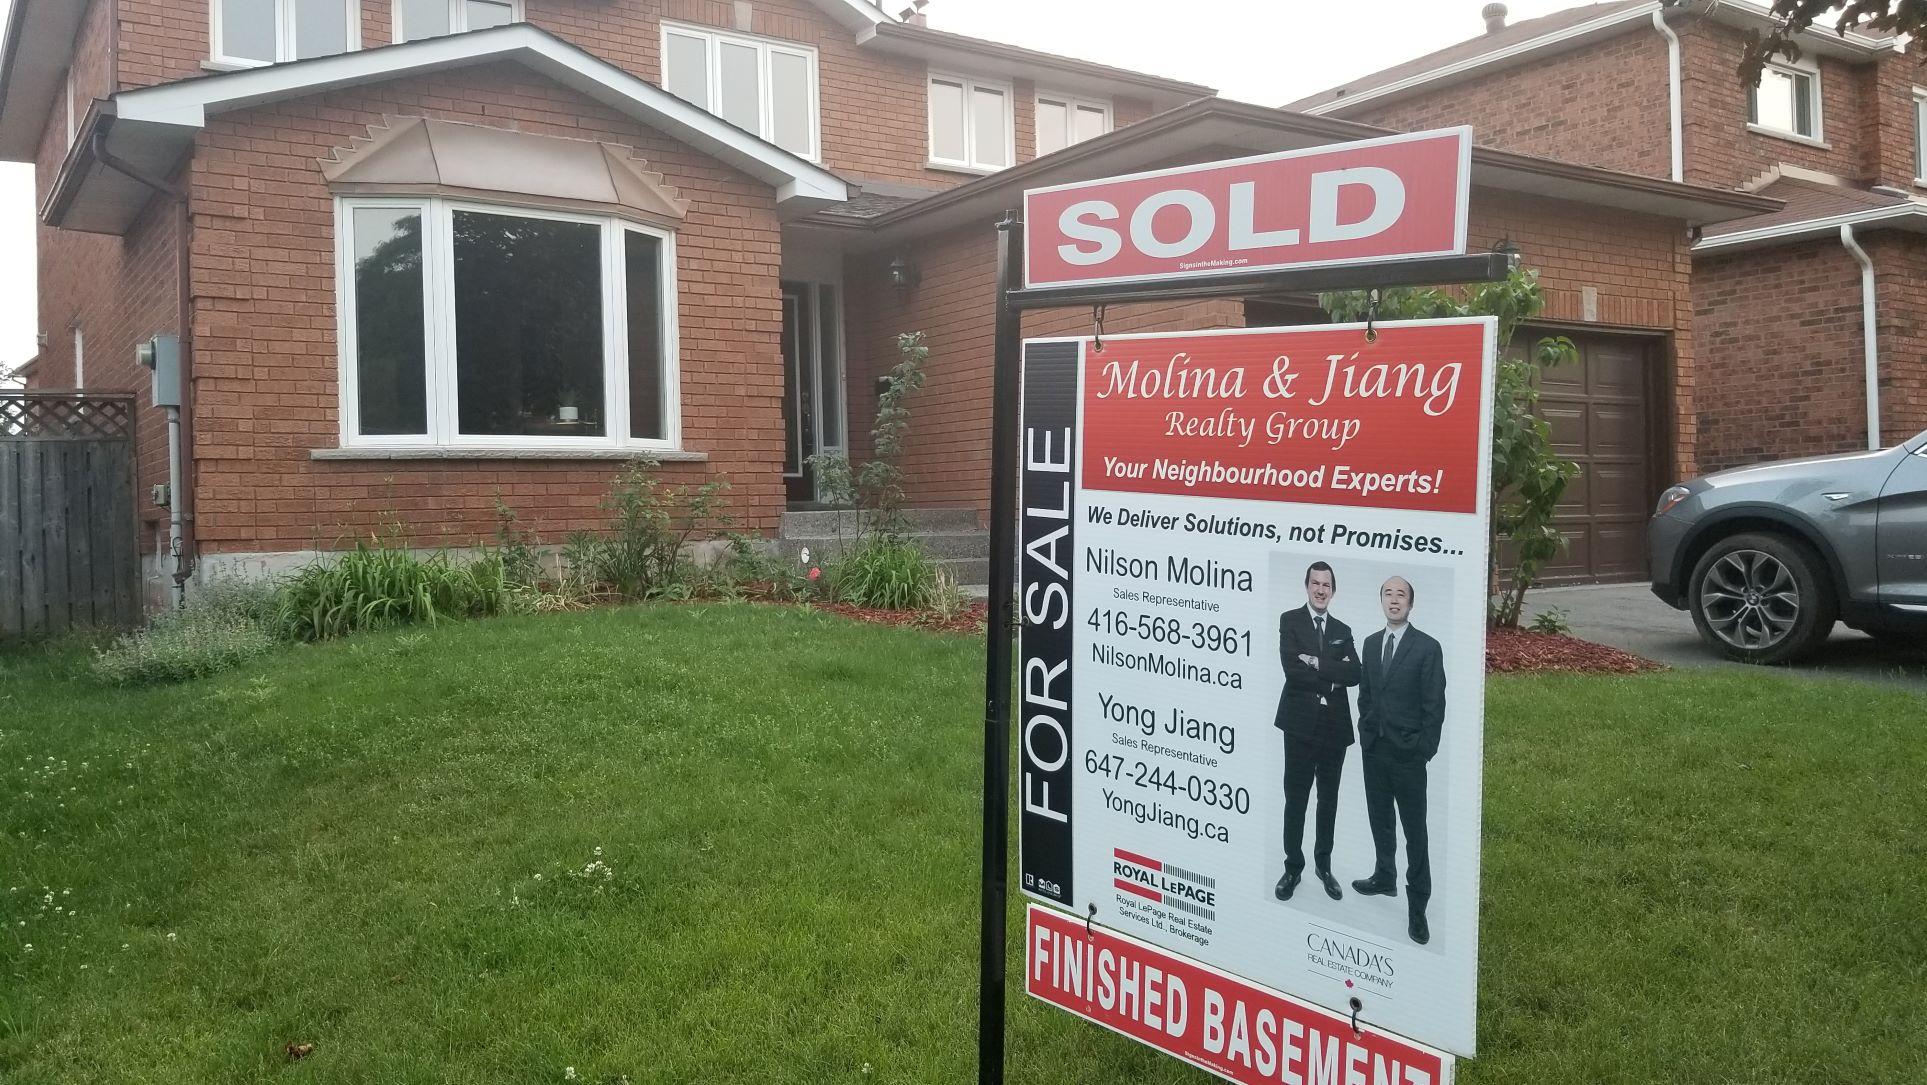
Recently SOLD in Wedgewood Creek, Oakville
Congratulations to one of my favourite Clients!
Market Stats - June 2021
There were 11,106 property sales reported last month across the GTA with the average price across all property types coming in at $1,089,536. Both the number of sales and average price reflect a transitioning of market activity over the past three months from a record pace that peaked in March 2021 to a more moderate yet robust pace in June. June 2021 was the first month under the new stricter mortgage stress test imposed by the federal government. This may have had a slight cooling effect on activity, but the drop in pace of sales is more likely reflecting that in the absence of normal population growth due to stalled immigration, a pent-up demand has been satisfied, as TRREB Chief Market Analyst Jason Mercer suggests. As TRREB President, Kevin Crigger points out, “A resumption of population growth based on immigration is only months away.” This anticipated influx and its associated housing demand will have an impact on the GTA market and may in part be informing the update to TRREB’s 2021 market forecast that has been revised upward from the initial 105,000 transactions to 115,000 transactions for the year. The forecast average selling price has also been revised upward to $1,070,000 from $1,025,000.
Market Stats for May 2021
May 2021 real estate sales continued the ongoing story of tight demand and strong price gains in the GTA market. Although the number of sales in May declined for the second month in a row since the March 2021 peak, activity was still above pre-pandemic levels as well as the 10 year monthly average for this period. The 17% reduction in new listings compared to April was reflected in the 19% increase in the MLS® Home Price Index Composite Benchmark in May. Along with other economists, RBC’s Robert Hogue expects this intense upward price pressure to persist in the near term. Condo sales showed a noteworthy comeback from the standstill a year ago and some months of price depreciation that followed. The 9.1% average price increase in May could be the beginning of a market rotation into the high rise condo segment. Condo construction wasn’t slowed by the pandemic, and Urbanation’s Shaun Hildebrand predicts that condo sales in the 416 will be the story of 2021.
Market Stats for April 2021
After 2021’s 1st Quarter of record sales, price appreciation, and market pace, the GTA’s robust spring market continued setting records in April. As the market in April 2020 was essentially frozen due to the pandemic, replacing year over year comparisons with 2015-2019 April averages offers better insight to how this April stacked up. April 2021’s record breaking sales for the month were 32% higher and active listings were approximately 26% lower compared to the five-year average for both measures, illustrating the historic tightness of the market. While April’s absorption rate slightly improved from March’s 2.9 weeks of inventory to 3.7 weeks, it was by virtue of the increase in new listings hitting the market - 16% higher than the 5-year monthly average - and not a slowing in sales. Together the increase in sales as well as the rise in new inventory indicate that existing home owners, who bring inventory with them, were central to April’s market activity. The increase in new listings is a positive sign that a less feverish market may be ahead.
Market Stats - March 2021
March completed the GTA’s 2021 Q1 real estate story with results consistent with January and February – record sales numbers, price appreciation and market pace. Comparing March 2021 numbers with the same month last year is, of course, somewhat problematic given COVID-19’s market-halting impact mid-March 2020. Looking at the activity for the quarter, the story has solidly been about inventory and pace of sales. February 2021 reported a record fast absorption rate of only 3.5 weeks of inventory in the GTA. Despite a 57% increase in new listings coming on market, March 2021’s absorption was even faster. With an average of 3,612 units selling per week, there was less than 3 weeks of available inventory. Add on a five-year Days On Market low of 10 DOM, and the speed of the market has never been faster. Finally, a quick word on Condos. Anyone looking for a bargain, won’t find it in the GTA. The very brief softening of condo prices in Toronto has passed and with sales activity surpassing even that of March 2017 – the previous high watermark for the month – it’s fair to anticipate renewed price acceleration for condos in the months ahead.
Market Stats - February 2021
February 2020 was our last full month before COVID-19 hit and what many thought, in the early days of the pandemic, could possibly have been our last productive month of 2020. What happened next will be remembered as one of the biggest surprises in GTA real estate history – a boom year in sales and price appreciation. February 2021 is continuing the trend. Comparing it to February 2020 offers interesting insights, especially when comparing Absorption Rates.
An Absorption Rate tells us in how much time the existing inventory of homes will sell if no other listings are added to the market. In pre-pandemic February 2020, sales were up by 45.6% over the previous year with units selling at a rate of 1,674.5 per week. That pace coupled with the month’s active listings, down by 33.6% from the previous year, resulted in a very tight 5.3 weeks of available inventory for buyers. In comparison, February 2021 sales were up by 52.5% over the previous year with units selling at a rate of 2,531.5 units per week. This February’s pace coupled with only 8,816 active listings, down 1% year over year for the period, resulted in a record low absorption rate of 3.5 weeks of inventory. Absorption Rate is usually expressed in months, not weeks, with 1 – 4 months of inventory classified as a Sellers’ market. February 2021’s Absorption Rate offers a clear illustration of supply and demand in the GTA and why prices continue to accelerate.
How to calculate the Absorption Rate
Market Stats - January 2021
If you’ve wondered what real estate sales in the GTA would do with a surge of supply, look no further than January 2021’s condo sales that hit a record year over year increase of 85.5%. While improved affordability - a slight depreciation in the average condo price of 4.7% combined with record low interest rates - would be a factor in the sales numbers, this is a story of availability in an otherwise inventory starved market and the massive demand that persists. January’s 2,766 detached home sales, up by 34.4% compared to January 2020, continue to demonstrate the high demand from buyers wanting more space even as average prices increased by nearly the same rate as sales.
Market Stats for the GTA - December 2020
With over 95,000 home sales, the GTA real estate market had its third strongest year on record in 2020. This represents an 8.4% increase over 2019 results despite coming to a near-standstill last spring. December 2020 sales were up a remarkable 65% from a year ago. Overall prices accelerated further, particularly in the detached home sector, under extremely tight demand-supply conditions. Condo inventories swelled in December with active listings up 172% in the 416 and 159% in the GTA. But while condo prices have continued to soften as inventories increase, their December 2020 sales were spectacular. At nearly 76% greater than for the same period last year, sales numbers indicate there’s no shortage of condo buyers in the GTA. Condos will be the market segment to watch in 2021.
Market Stats for the GTA - November 2020
GTA real estate remained remarkably strong in November with 8,766 sales – an increase of 24.3 per cent year over year – and a 13.3 per cent increase in the average selling price – the highest rate of price appreciation for the month since November 2016. Detached homes, once again, lead the market in sales and saw an increase in average price of 15.2 per cent over November 2019. Most popular were detached homes in the 905 area with sales up by over 33 per cent year over year and accounting for 38 per cent of November’s total sales of all property types. The number of condo sales was typical for the month of November and up slightly from this time last year. However, the 416 area saw prices soften slightly, as the number of new condo listings swelled to nearly double that of November last year.
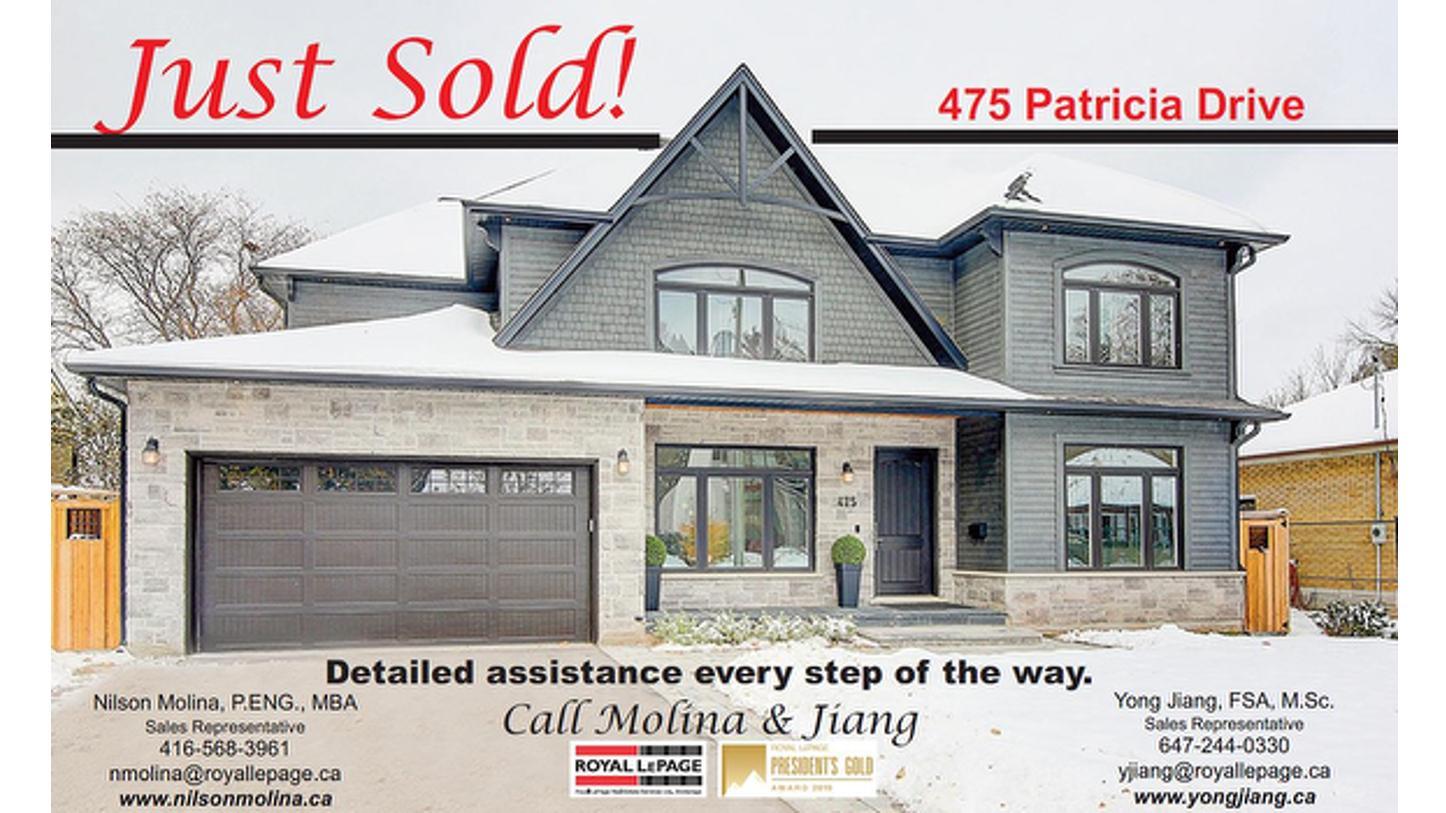
Recently SOLD in West Oakville!
Congratulations to our Amazing Clients, Alexandra and Antonio!
Great pleasure to work with them all the way!